Building a MFA Model
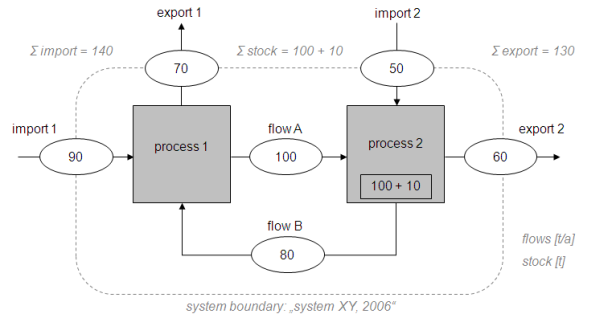
A typical MFA model looks like this:

It consists of the following components:
- System Boundary
The system boundary has to be defined in space and time. The spatial system boundary could be e.g. the logistical border of a company or the spatial border of a region, the temporal system boundary e.g. one balance sheet year. - Processes
Processes will be balanced (by using the law of mass conservation) only if they are located within the system boundary. Processes outside of the system boundary (displayed light grey in the diagram above) are not taken into account. Processes might contain stocks, or subsystems that can be described by extra models. - Flows
Internal flows connect processes within the system boundary while import and export flows cross the system boundary.
Not allowed are:
- Processes that are situated on the system boundary. They have to be either inside or outside of the system boundary.
- Flows that split. If you want to model such behavior, you have to use an additional splitting process.

The result of an MFA is a diagram where every flow and stock should have a
value.
The following kind of display is preferred:
- The flow ovals display mass flows.
- A stock within a process is symbolized by small rectangle. It contains data about the amount of stock at the beginning of the considered period of time +/- the change in stock during the period.
- A legend shows the units of the displayed data.
- The system boundary is labeled with the name of the system and the considered period. Additional information about the sum of imports, exports, stocks and changes in stocks are displayed.