Data Import and Export
Here you find information about the following topics:
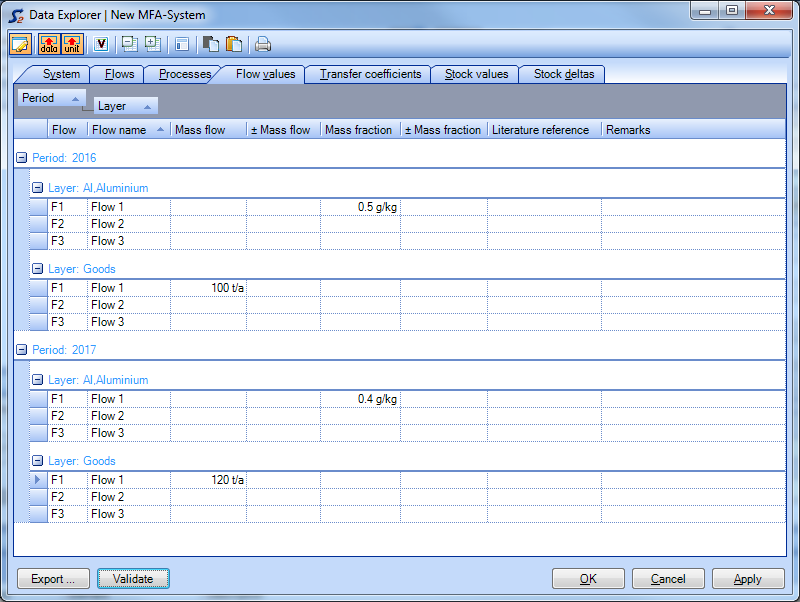
- Open Data Explorer
- Toolbar of Data Explorer
- Group Data Sets
- Sort Data Sets
- Select Data Sets
- Edit STAN Data
- Copy STAN Data Sets to Clipboard
- Insert Data Sets from Clipboard into STAN Data Table
- Export Data to Excel
- Import Data from Excel
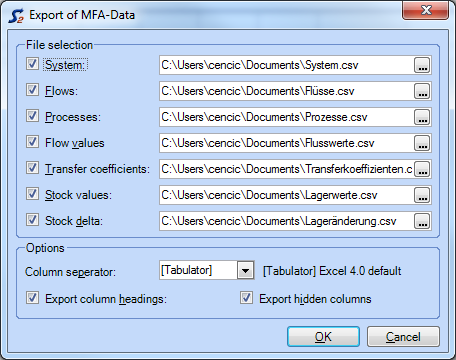
- Export Data to File
- Check Imported Data
- Close Data Explorer
Open Data Explorer
- On the Edit menu, click Data Explorer.
- Press CTRL+ D.
Toolbar of Data Explorer
 : Toggle between
edit mode (display of all digits of values) and display of data in diagram
formatting (no editing possible)
 /
/ : Toggle between entered (input)
and calculated (output) data.
 /
/ : Toggle between entered /input) and
display (output) units.
 : Show/hide
volume related columns.
 : Collapse all
groups.
 : Expand all groups.
 : Reset table
layout.
 : Copy selected rows to
clipboard.
 : Insert clipboard content.
 : Print data
table with preview (only printing of whole table on standard printer
possible).
Group Data Sets
Data sets can be grouped hierarchically by certain fields (= column headings).
- Drag the column heading you want to group by into the grey grouping area above.
- If a grouping hierarchy already exits, decide where to insert the column heading.
- Repeat the procedure until you have created the desired hierarchy.
- To change the hierarchy, drag one of column headings to another position in the grouping area.
- To remove a column heading from the hierarchy, drag it to any place in the data sets area.

Note:
- The default setting of the grouping hierarchy is periods >
layers. By clicking
 , you can restore this
setting anytime.
Sort Data Sets
- To sort data sets by certain fields (= column headings), click the according column headings.
- To include other fields in the sorting procedure, click additional column headings by simultaneously pressing SHIFT.
Note:
- Each click on a column heading changes the sorting order (alphabetically rising or falling).
Select Data Sets
- Click the row marker (= square) in front of a row to select a data set.
- For multiple selections, click additional row markers by simultaneously pressing CTRL.
- To select a data block, click the row marker of the first data set and
then by simultaneously pressing SHIFT the row marker of the last data set of
the block.
Alternatively, click the row marker of the first data set and sweep the mouse pointer to the last row marker while keeping the mouse button pressed.
Edit STAN Data
ATTENTION: To edit data, the edit mode  has to be switched on and input
data
  have to be
displayed.
- Select a cell in the data grid.
- Enter a text or a number (and optionally a unit directly behind the number), respectively.
Notes:
- On tab Flows and Processes, the short symbol and the name of the respective objects can be edited. Click Apply to show the changes on the other tabs.
- On each tab, remarks can be inserted/edited. To insert an additional line of text (later indicated by '...' behind the first line of text), press CTRL+Enter at the end of a line. To navigate through the lines, use the arrow keys. To jump to the end of the text in the last line, press CTRL+End.
- If no unit is entered behind a value, the display unit is assumed.
- The entered units will be checked automatically when the Data Explorer is closed or when Validate is clicked.
Copy STAN Data Sets to Clipboard
- Optional: Group and sort data sets.
- Select the desired data sets.
- To copy the rows to the clipboard, click
 or press CTRL+C.
Note:
- This copy action also includes columns of the data grid that are not displayed (e.g. calculated values).
Insert Data Sets from Clipboard into STAN Data Table
- Select the target area (rules see select data sets).
- To insert the data sets from clipboard into the STAN data table, click
 or press CTRL+V.
- Click OK or Apply.
Notes:
- To insert data, the edit mode
 has to be switched on and input
data
  have to be
displayed.
- Only those parts of the data sets of the clipboard will be inserted that fit into the target area.
- This action also includes columns of the data grid that are not displayed (e.g. calculated values).
Export Data to Excel
- Copy data sets from STAN data table to clipboard.
- Switch to Excel, select a cell and press CTRL+V to insert the data sets from clipboard into Excel.
Note:
- This copy action also includes columns of the STAN data table that are not displayed (e.g. calculated values).
Import Data from Excel
- In the Excel table, select a block of cells containing data.
- Press CTRL+C to copy this data block to the clipboard.
- In the STAN data table, click the upper left cell of the region where you want to insert the data block.
- Click
 or press
CTRL+ V to insert the data block from the clipboard into the STAN
data table.
Note:
- To insert data, the edit mode
 has to be switched on and input
data
  have to be
displayed.
- The user has to pay attention to the correct assignment of the data block! I.e. group and sort data sets in STAN and/or Excel to give them the same order.
- If the imported data block contains a mixture of different data types (mass flows, volume flows, mass fractions, mass concentrations), they will automatically be assigned to the correct columns. If the block is inserted into a mean value column the data will be moved to the correct mean value columns. Inserting into a uncertainty column works the same.
Export Data to File
- On the bottom of the STAN data table, click Export.
- Choose which data (system, flows, processes, flow values, transfer coefficients, stock values, stock delta) you want to export.
- Enter path, name and extension (csv, .txt) of file(s).
- Choose from options if you want to export column headings and/or hidden columns (e.g. calculated data).
- Click OK.

Check Imported Data
- In the STAN data table, click Validate.
Notes:
- If the data contains a syntax error, a warning will be displayed and the cells with errors will be marked.
- Using tool tip, you can display the error of each cell.
-
The data will be checked automatically if OK or Apply is clicked.
Close Data Explorer
- Click OK or Apply to accept the changes.
- Click Cancel to reject the changes.