Flows
Here you find information about the following topics:
- Insert Internal Flow
- Insert Import or Export Flow
- Select Flow
- Connect Flow to Process or Change Anchor Point
- Change Flow Type
- Toggle Import and Export Symbols
- Rename Flow Manually
- Rename Flow Automatically
- Set Flow Options
- Change Flow Course
- Move Flow Parallel
- Change Flow Style
- Delete Flow
- Change Flow Color
- Change Flow Label Size
- Move Flow Label
- Alignment of Flow Label and Text
- Move Flow Oval
- Alignment of Flow Oval
- Enter Flow Values and/or Concentrations
- Adjust Sankey Display of Flows
- Format Flow Values
- Time Series of a Flow
- Document Flow Value
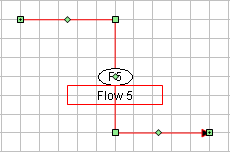
Insert Internal Flow
An internal flow connects two processes (inside of the system boundary).
- On the Shapes window, select the Shapes tab and click
 , or select the Flow
Types tab and click the desired Connection Type symbol.
, or select the Flow
Types tab and click the desired Connection Type symbol.
- On the Drawing Area, drag the pointer from the starting point to the end point of the internal flow.
- Alternatively, on the Drawing Area, click next to an anchor point of a process to insert an internal flow of predefined length with its starting point connect to the selected anchor point. The flow will leave the process perpendicular to the side where the anchor point is located.
Notes:
- If the mouse pointer hovers over or narrow to a process during setting the start or end point, the flow will be automatically connected to the next free anchor point (= grid point on the border of a process) of the process.
- To insert a flow with predefined length that is not connected to any processes, simply click the Drawing Area.
- An internal flow that is not connected correctly with two processes will be displayed with a dashed line.
- If an internal flow is connected to only one process, it will be considered as an import or export flow during calculation.
Insert Import or Export Flow
Import and export flows represent flows that connect a system with its surrounding area. They cross the system boundary and are connected to a process within the system boundary. The surrounding area is displayed as a circle labeled with I or E.
- On the Shapes window, select the Shapes tab and click
 (import flow) or
  (export flow).
- On the Drawing Area, click next to an anchor point of a process to insert an import/export flow of predefined length with its end/starting point connect to the selected anchor point. The flow will leave the process perpendicular to the side where the anchor point is located.
- Alternatively, on the Drawing Area, drag the pointer from the starting point to the end point of the flow.
Notes:
-
If the mouse pointer hovers over or narrow to a process during setting the starting (with export flows) or end point (with import flows), the flow will be automatically connected to the next free anchor point (= grid point on the border of a process) of the process.
- To insert a flow with predefined length that is not connected to any processes, simply click the Drawing Area.
- An import or export flow that is not connected correctly to one process will be displayed with a dashed line.
Select Flow
- On the Shapes window, click
 to switch to the edit mode.
- On the Drawing Area, click a flow.
Connect Flow to Process or Change Anchor Point
- Select a flow.
- Drag the start or end point of the flow (small green square with + sign) close to a free potential anchor point of a process.
Notes:
- The flow will be automatically connected to the process by auto snap.
- Potential anchor point can be found on the border of a process next to grid points.
Change Flow Type
- Right-click a flow.
- From the shortcut menu, select the fitting flow type by setting or deleting a tick.
-
If there is no tick visible in front of Import or Export Flow, the flow is considered an internal flow.
Toggle Import and Export Symbols
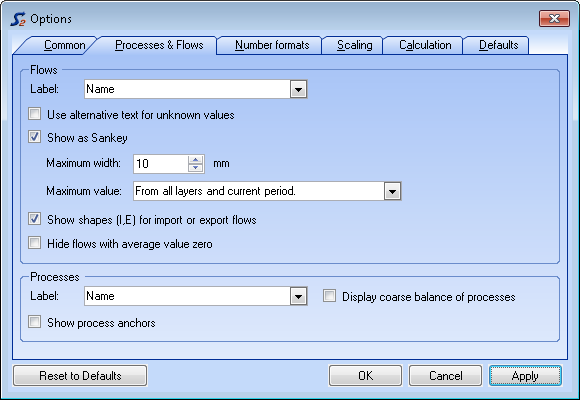
- On the Extras menu, select Options and click the Processes & Flows tab.
- On the Flows pane, toggle Show shapes (I,E) for import and export flows.
Rename Flow Manually
- Select a flow.
- On the Properties window, select the Flow tab.
- Enter short symbol, name and remarks.
- Optionally, enter an alternative text that shall be displayed inside of the flow oval if no value is given.
Notes:
- Flows can also be renamed directly within the Data Explorer (see Edit STAN Data).
- Per default, the short symbol of a flow will be displayed inside of the flow oval if the value is unknown.
- The alternative text will be used if the respective option under Extras - Options - Processes & Flows is activated.
Rename Flow Automatically
- Select a flow.
- On the Properties window, select the Flow tab.
- Click
 next to the text
field for short symbol or name.
next to the text
field for short symbol or name.
- In the Flow Catalog window, select an Excel file (= catalog), that contains the flow names, short symbols and remarks of often used flows.
- Click Settings to select which worksheet of the Excel file contains the data, how many data sets are available (e.g. 2000) and in which row the first one can be found. Define also which column (e.g. A) contains short symbol, name and description. Confirm with OK.
- Enter a search term in text field search. Select a filter (all fields, short symbol, name, description) from the drop down menu next to it. All fitting data sets will be listed that contain the search term.
- Select a data set by double-clicking or select it and click OK.
Set Flow Options
- On the Extras menu, select Options and click the Processes & Flows tab.
- The following settings can be made under Flows:
- Type of flow label caption (short symbol and/or name, default = name)
- Use alternative text for unknown values (default = short symbol)
- Activate Sankey display of flows. This can also be done by clicking
 in the Sankey
toolbar.
in the Sankey
toolbar.
How to set the maximum width of the Sankey arrows and its reference value see Adjust Sankey Display of Flows. - Show shapes (I, E) for import and export flows
- Hide flows with mean value zero
Change Flow Course
- Select a flow.
- Drag one of the appearing green handles of the flow to the desired position.
-
The pointer picture indicates the possible directions of movement.
Move Flow Parallel
Precondition: flow must be detached from processes.
- Select a flow.
- Internal flows: Drag the oval to its new position.
- Import or export flows: Drag the I or E shape to its new position.
Change Flow Style
You can choose from flow styles with different features (e.g. orthogonality, number of inflection points).
- Right-click a flow.
- From the shortcut menu, select Flow Styles. Choose one of the offered flow styles.
or
- Select a flow.
- On the Shapes window, select the Flow Types tab.
- Right-click the desired Connection Type symbol and select Apply Flow Style.
Notes:
- This function is also available for multiple selections of flows.
- The offered flow styles have to be considered symbolically: a horizontal part can either go left or right, a vertical part either up or down.
Delete Flow
- Select a flow.
- On the Diagram toolbar, click
 or press Delete.
Change Flow Color
- Select a flow.
- On the Properties window, select the Shape tab.
- From the Color drop-down list, select the desired color.
Change Flow Label Size
If not all of the text in a flow label can be seen, you have to adjust its size.
- Select a flow label.
- Drag one of the green handles on the perimeter of the flow label to the desired position.
Note:
- The pointer picture indicates the possible directions of movement
Move Flow Label
- Select a flow label.
- Drag the flow label to its new position.
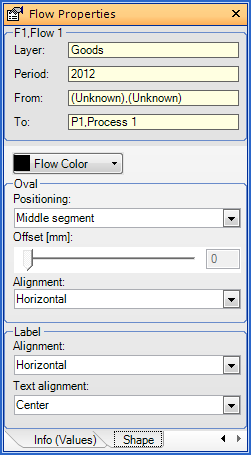
Alignment of Flow Label and Text
- Select a flow.
- On the Properties window, select the Shape tab.
- From the drop-down lists in region Label, select alignment of flow label (horizontal, vertical) and alignment of text in label (left, center, right).
Move Flow Oval
- Select a flow.
- On the Properties window, select the Shape tab.
- On the Oval pane, choose the position (first, middle, last segment) or the starting point (relative to begin or end of arrow) of a movement.
- If you have chosen a starting point for a movement, use the slider to manually adjust the position of the oval along the path of the arrow or enter the offset in mm.
Alignment of Flow Oval
- Select a flow.
- On the Properties window, select the Shape tab.
- From the drop-down lists in region Oval, select the alignment of text in flow label (horizontal or vertical)
Enter Flow Values and/or Concentrations
- Select a flow.
- On the Properties window, select the Values tab.
- Enter flow values and/or concentrations (only possible with substances) and, if known, their uncertainties.
- If you want use another unit than the displayed one, enter it directly behind the number (e.g. 100 kg/a) or click the unit button to choose from predefined units.
- On the layer of goods, you can enter optionally mass flow, volume flow and/or density.
- On the layer of substances, you can enter optionally mass flow and/or concentration (mass substance per mass or volume good respectively).
- On the layer of energy, you can enter optionally energy flow and/or concentration (energy per mass or volume good respectively).
Notes:
- If you want to consider data uncertainties, you can enter the range of uncertainty in form of the standard uncertainty in the data field right of the +- sign. The data set will be interpreted as mean value and standard uncertainty of an assumed normal distribution.
- Uncertainties can also be entered in percent if a mean value is already given (e.g. 10%). The entry will be automatically transformed into an absolute value.
- By default, entered data will be displayed optionally with a maximum of 2 digits after the decimal point. I.e. if the number has more than two digits after the decimal point it will be displayed rounded.
Adjust Sankey-Display of Flows
- On the Diagram toolbar, click to toggle the Sankey display of
flows.
- On the Diagram toolbar, use the slider to manually adjust the relative width of the Sankey arrows.
or
- On the Extras menu, select Options and click the Processes & Flows tab.
- On region Flows, toggle Show as Sankey.
- Enter the maximum width of a Sankey arrow.
- Select the scope of layers and periods (current layer and all periods; all layers and all periods; current layer and current period; all layers and current period) where all flows are to be displayed proportional to its maximum value.
Note:
-
If under point 4 a setting with "all layers" is selected, the display units of substance layers for mass/time and mass will be automatically adjusted to the display units of the layer of goods.
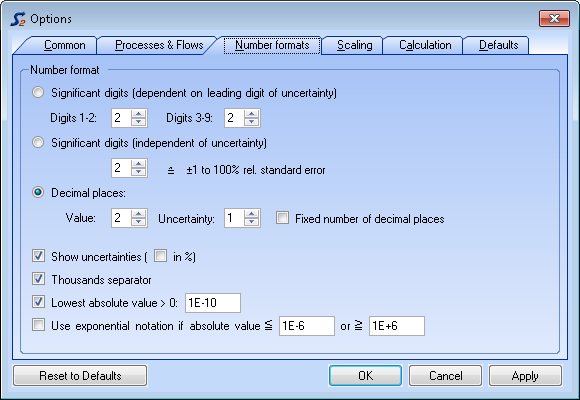
Format Flow Values
- On the Extras menu, select Options and click the Number Formats tab.
- Choose the desired number format (rounded to significant digits or decimal places). For details refer to the notes below.
- Choose if data uncertainties shall be displayed and, if yes, in % or absolute values.
- Choose if thousands separators shall be displayed.
- Choose if values lower than the stated threshold shall be displayed as zero.
- Choose if values lower and higher that the stated thresholds shall be displayed in exponential notation.
-
Select Significant digits (depending on leading digit of uncertainty) to round the uncertainties (depending on their leading digits) to the given number of significant digits. The position of the least significant figure in the uncertainty determines the position of the respective mean value to be rounded. If uncertainties are displayed in percent, the number of decimal places stated under Decimal places will be used.
-
Select Significant digits (independent of uncertainty) to round the mean values to the given number of significant figures. Uncertainties will not be taken into account and therefore be hidden. To the right of the chosen number of significant figures the respective range of uncertainty incorporated with this choice is displayed.
-
Select Decimal places to round the mean values and the uncertainties to the respective given numbers of decimal places. If uncertainties are displayed in percent, also the number of decimal places stated under Uncertainty will be used. If Fixed number of decimal places is selected, the chosen decimal places will always be displayed even if they are zero, otherwise not.
Time Series of a Flow
- Right-click a flow and select Show Time Series.
![]()
Document Flow Value
The documentation of data is an essential point when performing a MFA. Because of that each flow value can be documented for each layer and period separately with respect to literature reference and additional notes.
- Select a flow.
- In the Property window, select tab Info (values).
- Enter a new literature reference under Literature reference (and
click on any other text field in the property window afterwards) or select an
already defined one from the dropdown list.
If you have entered a new reference, you will be asked if you want to create a new reference. Choose Yes to make this reference available as template in the dropdown list for future documentation work. - Enter Remarks.
Note:
- Flow data and its documentation can also be edited directly within the Data Explorer (see Edit STAN Data).