Processes
Here you find information about the following topics:
- Insert Process
- Select Process
- Move Process
- Delete Process
- Rename Process
- Set Process Caption
- Change Process Type
- Change Process Color
- Toggle Used Anchor Points
- Change Process Size
- Set Default Process Size
- Edit Subsystem
- Edit Transfer Coefficients
- Enter Stock/Change in Stock and/or Concentration
- Format Process Values
- Display Process List
- Document Stock Values
Insert Process
- On the Shapes window, click
 .
.
- On the Drawing Area, drag-and-drop your pointer to draw a process or click the position where you want to insert a process with predefined size.
Select Process
- On the Shapes window, click
 to switch to the edit mode.
- On the Drawing Area, click a process.
Move Process
- Select a process.
- Drag the process to its new position.
Delete Process
- Select a process.
- On the Diagram toolbar, click
 or press Delete.
Rename Process
- Select a process.
- On the Properties window, select the Process tab.
- Enter short symbol, name and remarks (general information about the process).
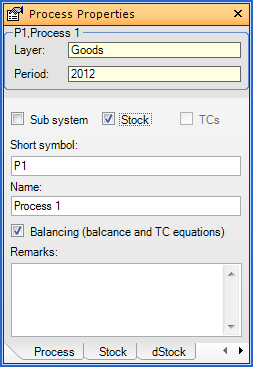
Note:
- Processes can also be renamed directly within the Data Explorer (see Edit STAN Data).
Set Process Caption
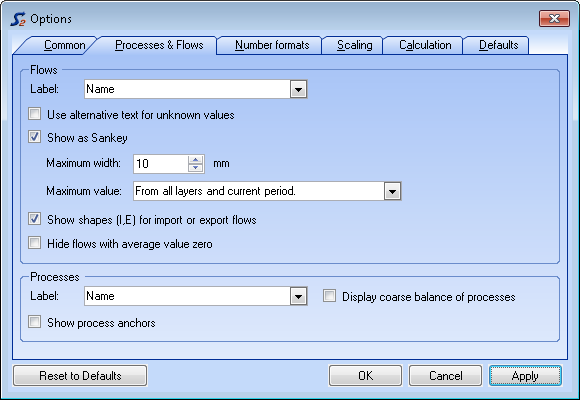
- On the Extras menu, select Options and click the Processes & Flows tab.
- On the Process pane, select the type of process label caption (short symbol and/or name)
-
The default caption type for processes is name.
Change Process Type
You can define a process with stock, without stock or as subsystem.
- Select a process.
- On the Property window, select the Process tab.
- Set or delete a tick in the desired checkbox (subsystem, stock, TCs).

Note:
-
It is possible to create up to six hierarchical subsystem layers.
-
If a subsystem or a process with stock is reset to a normal process (by taking away the tick), data and objects that are of no use anymore will be deleted after a warning.
Change Process Color
- Select a process.
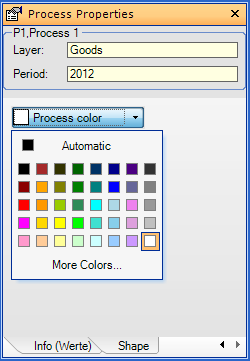
- On the Properties window, select the Shape tab and choose the desired process color.
Toggle Anchor Points
- On the Diagram toolbar, toggle
 .
.
Notes:
- Potential anchor points are located on the border of a process on grid points.
- Anchor points are created automatically when a flow is connected to a process.
Change Process Size
- Select a process.
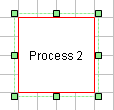
- Drag one of the green handles on the perimeter of the process to the desired position.
Notes:
- The pointer picture indicates the possible directions of movement.
- The position of anchor points stays the same when the process size is changed.
- The size reduction of processes is limited by existing anchor points.
Set Default Process Size
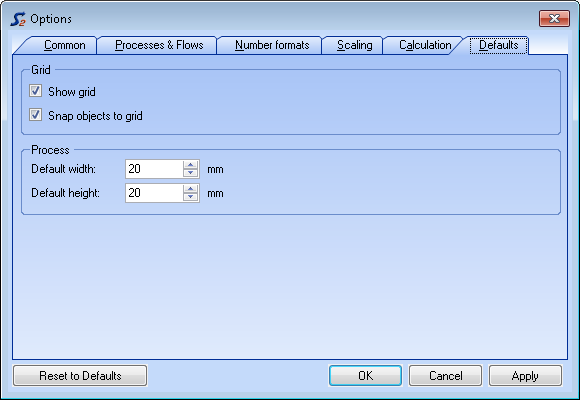
- On the Extras menu, select Options and click the Defaults tab.
- On the Process pane, enter default width and height of a process in mm.
- Click OK or Apply.
Note:
- The minimum width and height is 10mm.
-
Settings on the Grid pane influence only new MFA documents, while settings on the Process pane influence only new inserted processes.
Edit Subsystem
This is possible only if the process has been defined as subsystem.
- Double-click a subsystem.
or
- Select a subsystem.
- On the Edit menu, select Edit Subsystem or use the context menu (right-click) of the subsystem.
Result:
- A new drawing area opens, in which all the flows connected to the subsystem already exist.
Notes:
- The border of a process containing a subsystem is displayed in blue.
- You cannot delete import and export flows on the subsystem layer. This has to be done on the superior layer.
- In a subsystem only additional internal flows and processes can be inserted to model the subsystem in more detail.
Edit Transfer Coefficient
Transfer coefficients can be entered only if the process is no subsystem and contains no stock.
- Double-click a normal process (without stock and subsystem)
or
- Select a process without stock.
- Right-click the process and choose Edit Process from its
context menu
or
On the Edit menu, select Edit Process.
or
In the Property window select the tab TC and click Edit
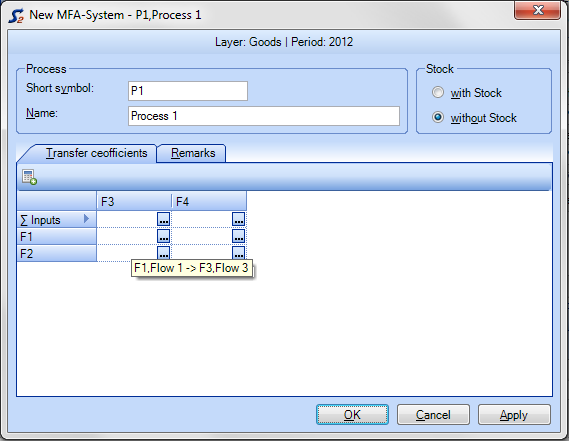
In the Process dialog window on the tab TC, you see a given matrix where you can enter transfer coefficients with respect to the sum of inputs or single inputs. - Enter transfer coefficients directly into the fitting cells. You can choose between two different ways: a number between 0 and 1 (e.g. 0.6) or a percentage number (e.g. 60%).
- To enter data uncertainties of transfer coefficients (in form of
standard uncertainty of an assumed normal distribution), write +-
directly after the mean value and enter the absolute value of the
standard uncertainty (e.g. 0.60+-0.06 or 60%+-6%).
Alternatively, click to open an edit
dialog. Only there it is possible to enter literature and remarks.
- Click OK or Apply.
Notes:
- If you want STAN to calculate transfer coefficients with respect to the sum of inputs, enter a question mark in one of the cells of the first matrix row.
- If you hover over a cell of the matrix, a tooltip with information (long name) about the input and output flows will be displayed.
Enter Stock/Change in Stock and/or Concentration
This is possible only if the process includes a stock.
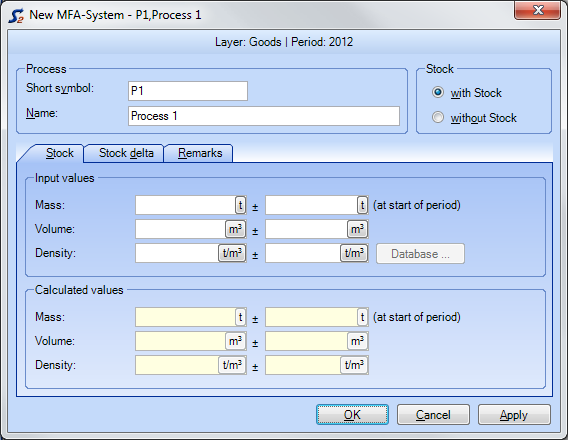
- Double-click a process with stock.
- Select tab Stock/dStock.
- Enter a value in one of the text fields (mean value and optional uncertainty).
- If you want use another unit than the displayed one enter it directly behind the number (e.g. 100 kg/a) or click the unit button to choose from predefined units.
or
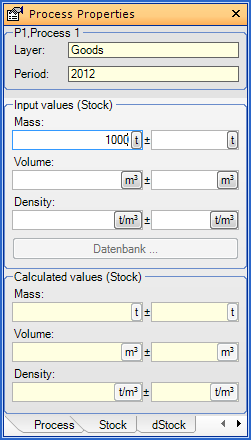
- Select a process with stock.
- In the Property window, select tab Stock/dStock.
- Enter a value in one of the text fields (mean value an optional uncertainty).
- If you want use another unit than the displayed one, enter it directly after the number (e.g. 100 kg/a) or click the unit button to choose from predefined units.
Notes:
- On the layer of goods, you can enter optionally mass/mass flow, volume/volume flow and/or density.
- On the layer of substances, you can enter optionally mass/mass flow and/or concentration (mass substance per mass or volume good respectively).
- On the layer of energy, you can enter optionally energy/energy flow and/or concentration (energy per mass or volume good respectively)
- If you want to consider data uncertainties, you can enter the range of uncertainty in form of the standard uncertainty in the data field right of the +- sign. The data set will be interpreted as mean value and standard uncertainty of an assumed normal distribution.
- Uncertainties can also be entered in percent if a mean value is already given (e.g. 10%). The entry will be automatically transformed into an absolute value.
- By default, entered data will be displayed optionally with a maximum of 2 digits after the decimal point. I.e. if the number has more than two digits after the decimal point it will be displayed rounded.
Format Process Values
See Format Flow Values.
Display Process List
A process list shows a list of all processes with their input and output flows.
- On the Edit menu, click Process List.
- Click
 to
export the process list as Excel 2003 file.
Notes:
- The displayed flow values depend on the selected layer.
- To group the data sets hierarchically, drag the column headings into the grey area above.
- If you want to restore the standard settings, click
 .
.
Document Stock Values
The documentation of data is an essential point when performing a MFA. Because of that each stock/change in stock value can be documented for each layer and period separately with respect to literature reference and additional notes.
- Select a process with stock.
- In the Property window select tab Info (values).
- Enter a new literature reference under Literature reference (and
click on any other text field in the property window afterwards) or select an
already defined one from the dropdown list.
If you have entered a new reference, you will be asked if you want to create a new reference. Choose Yes to make this reference available as template in the dropdown list for future documentation work. - Enter Remarks.
Note:
- Process data and its documentation can also be edited directly within the Data Explorer (see Edit STAN Data).